Cement is one of the largest industrial sources of CO₂, and most of it comes from making clinker. Carbon pricing under the EU Emissions Trading System and growing investor scrutiny are raising the cost of every tonne emitted, and many plants still run decades-old kilns on conservative control loops that waste fuel.
Carbon capture and other capital projects take years to deliver, while tighter process control works on the kiln line the plant already has. A model that learns the plant's own behavior can adjust setpoints continuously to reduce fuel use, electricity use and clinker factor without a retrofit, and it can sit alongside the longer-cycle projects.
Map the CO₂ sources before optimizing
Start by sizing each source of carbon in the plant. Limestone calcination is the largest source. The fossil or alternative fuels that keep the kiln at temperature are the next largest, and the electricity that drives mills, fans and conveyors makes up a smaller remainder. Calcination CO₂ follows from the amount of clinker made, so process control acts on fuel, power and the clinker factor.
Because the kiln dominates, small control slips become large carbon excursions:
- over-burning clinker
- false air drawn into the preheater
- mills recirculating excess fines
- induced-draft fans surging
Each wastes energy and raises the site's footprint. Conventional distributed control systems often hold conservative temperature and draft setpoints to protect quality, and those margins cost fuel and power every hour.
Prioritize where the return is largest. Stabilize burning-zone temperature and excess air first, to cap fuel CO₂. Then trim fan loads and grinding circuits, which drive Scope 2 emissions from purchased power. Broader plant-wide energy work can then build on those. The process control levers for cement decarbonization cover the wider picture, including clinker substitution and alternative fuels.
Use live plant data to expose hidden losses
Streaming sensor, lab and energy-meter data reveals process swings that monthly reports smooth over. When kiln inlet temperature, fan power and free lime are watched in real time, losses surface within minutes instead of weeks.
A sudden free-lime spike often prompts operators to raise burning-zone temperature, adding fuel the clinker may not need. A jump in ID fan load wastes energy per tonne of cement. Small drifts in raw meal chemistry push the kiln toward over-burning. Each raises CO₂ intensity.
Analysis built on live data can flag these events as they happen, relate excess O₂, false air and rising fuel rate, and rank each event by its energy cost so the team tackles the largest first. Multivariable models follow hundreds of variables at once and separate cause and effect in ways a manual review cannot. Continuous monitoring also provides the before-and-after evidence to verify each improvement and keep it.
Run the kiln continuously at its best point
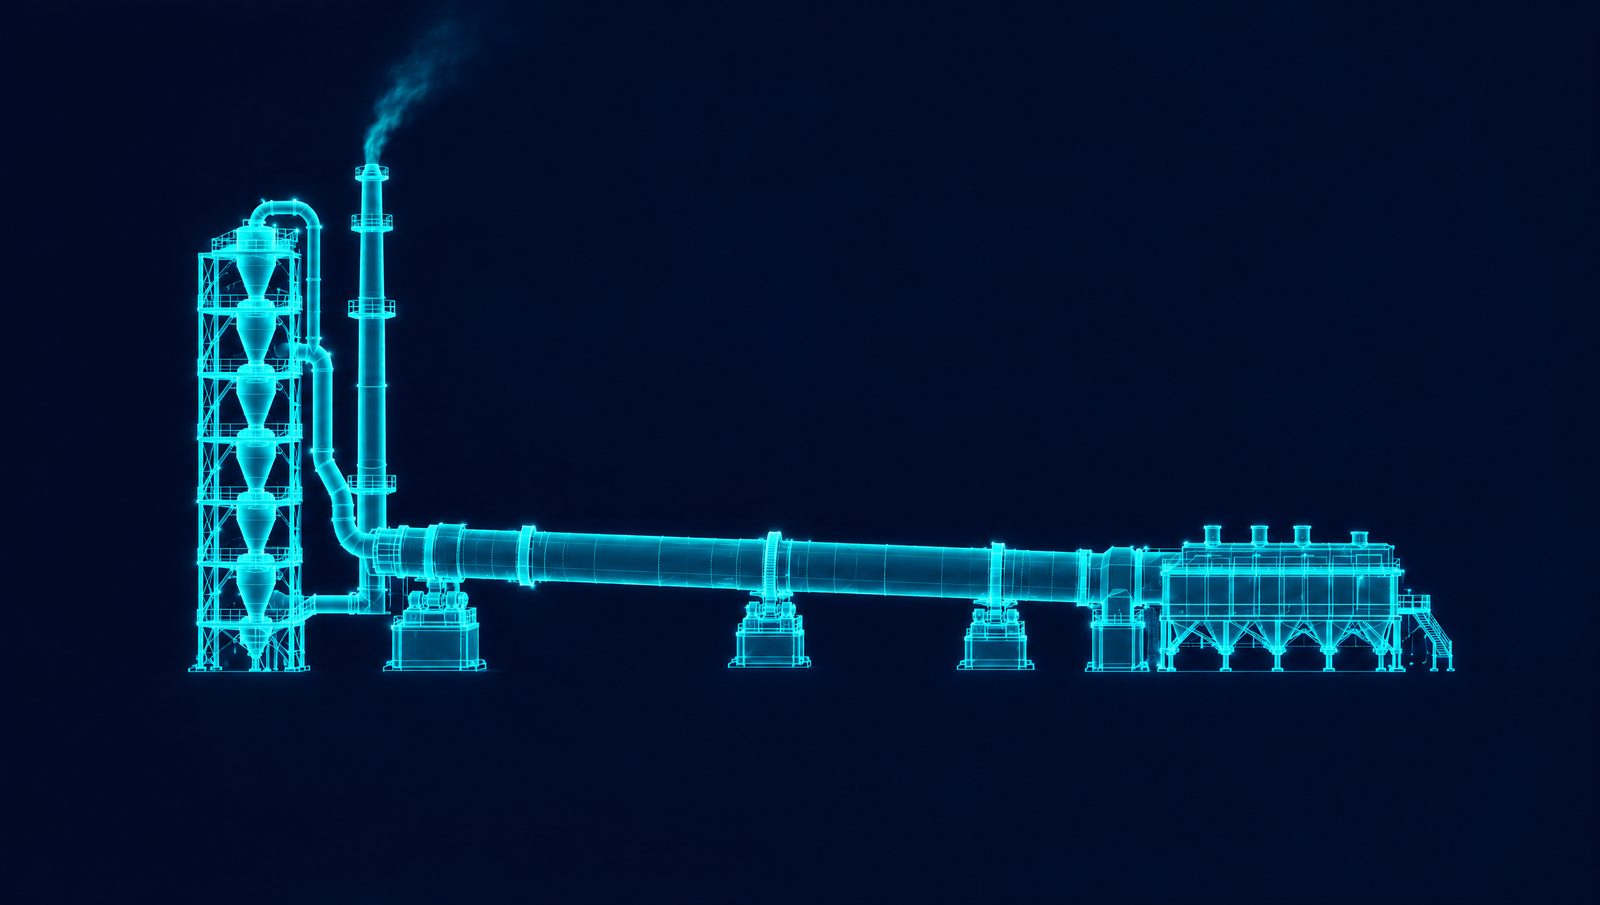
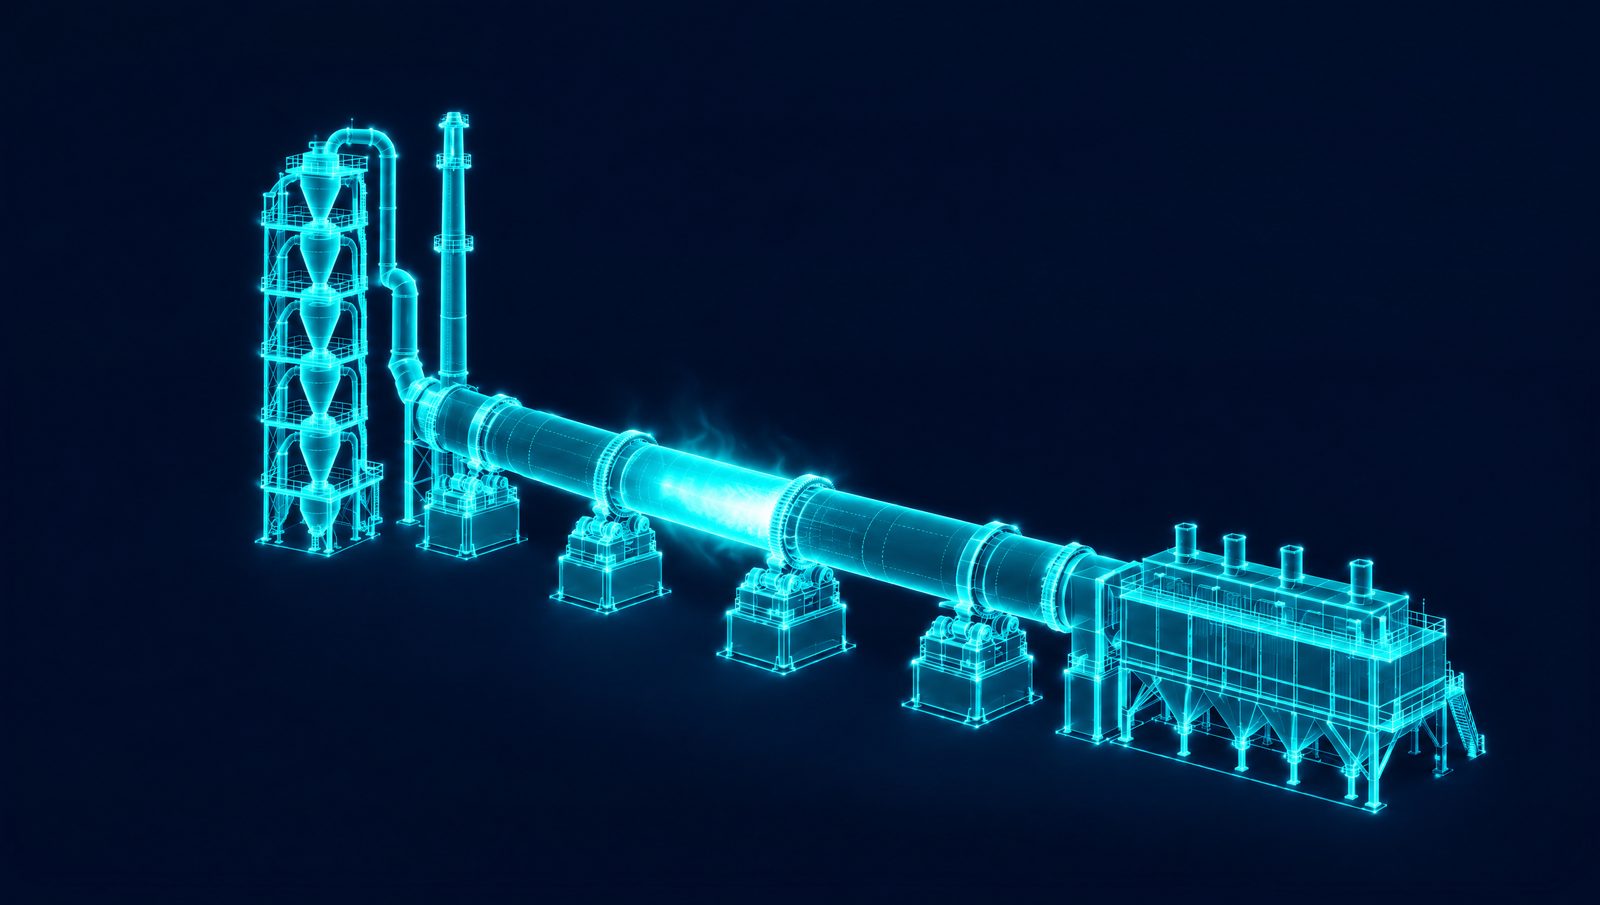
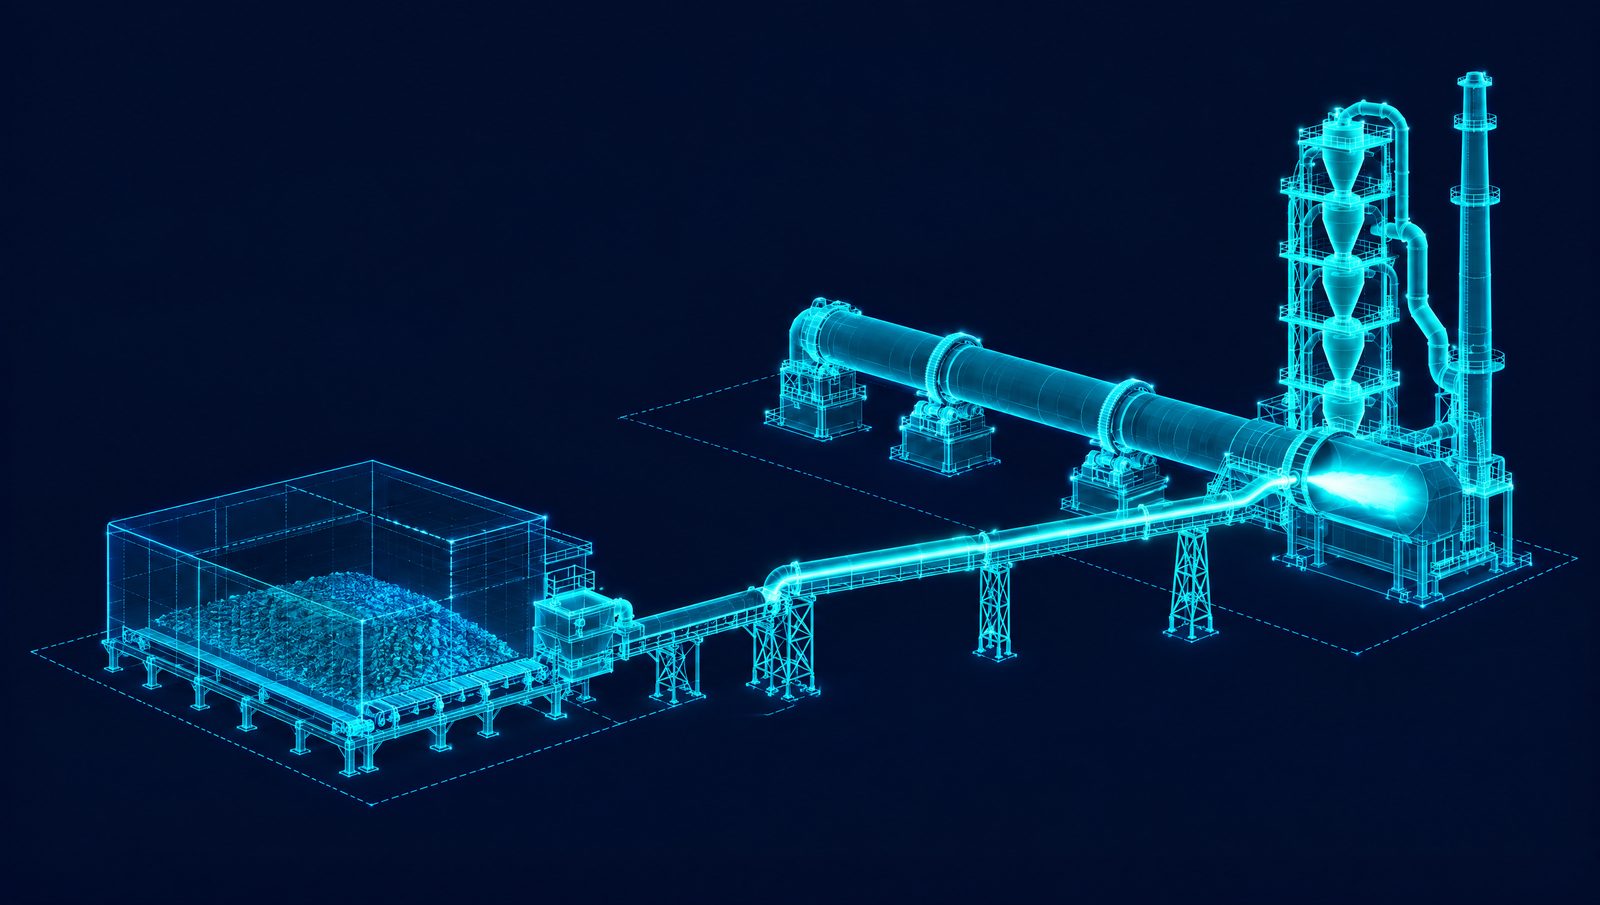
Kiln firing drives most of a plant's fuel bill, yet operators still rely on fixed safety margins that over-fire clinker. A controller that reads live temperature, gas and feed data can adjust burning-zone temperature, air ratios, burner momentum and fuel flow continuously, holding quality targets with less heat input.
The core is a predictive model that anticipates process upsets minutes ahead and trims fuel before deviations develop. Dynamic setpoint control removes conservative cushions, and combustion stabilization keeps flame shape and heat transfer steady. The aim of this closed-loop approach is lower specific heat consumption without giving up clinker quality.
Because the model is learned from the plant's own data, it can follow shifts in raw meal chemistry, alternative fuel blends and ambient conditions. Fewer disturbances mean fewer kiln stops, less refractory stress and lower CO₂ per tonne of clinker.
Key parameters to track and optimize in the kiln include:
- burning-zone temperature
- kiln inlet O₂ and CO
- draft pressure at the hood and the preheater
- fuel and air flow rates by burner zone
- free lime, from a soft sensor between lab samples
- cooler vent temperature
Tune energy-intensive setpoints beyond the kiln
Fans, cyclones and grinding mills are large power users, and their setpoints often sit on conservative margins. Closed-loop control on top of the DCS can trim those margins continuously and cut electricity use without putting stability at risk.
Start with draft control. A model that follows kiln O₂, CO and pressure trends can move ID and FD fan speeds just enough to hold safe combustion. Less excess air lowers fan power and keeps more heat in the system.
The same logic extends through the plant. Preheater draft control matches cyclone pressure drops to feed chemistry and moisture, which reduces stack losses. In grinding circuits, the controller can stabilize circulating load, adjust vertical roller mill (VRM) grinding pressure and recirculation, and trim separator speed to hit Blaine targets with fewer kilowatt-hours.
Adapt in real time to raw material and fuel variability
Quarry seams shift. Alternative fuel batches arrive with different heating values. When those changes hit, operators typically add heat to avoid quality problems, which raises energy use and unsettles clinker chemistry.
A controller can instead monitor lime saturation factor, moisture and calorific value, and adjust raw-mix feeders, fuel flow and air ratios as the changes arrive. Raw-mix correction keeps LSF, silica modulus (SM) and alumina modulus (AM) on target when the belt analyzer detects chemistry drift. Flame control steadies combustion when fuel properties swing, which keeps the manufacturing process consistent.
The same models can adjust mill water and separator speed to hold a consistent, dry meal. That removes the over-firing normally used to compensate for variability. Stable clinker mineralogy also allows higher fly ash or slag additions without losing strength, which lowers the clinker factor and the CO₂ embedded in it.
Treat the plant as one heat and mass balance
Plant-wide optimization yields larger decarbonization gains than isolated improvements, because all the equipment shares the same heat and mass balance. Coordinating several setpoints at once trims waste across the plant: draft control lowers fan power and stack heat loss together, and better grinding control avoids quality giveaway. Each cut in electricity use lowers the plant's indirect CO₂ in proportion.
This runs as software on top of the existing distributed control system, without major capital. The same model can replay historical operation as a training environment, showing operators where the opportunities were.
A steadier kiln line prepares for deeper decarbonization
Closed-loop control does more than trim today's fuel bill. Steadier burning-zone temperature, tighter excess-air control and lower quality variability make a leaner, more stable kiln line. That stability matters for capital projects such as carbon capture or hydrogen firing. Smaller swings in flue gas flow and composition make a capture unit easier to size and run, with fewer surprises at retrofit.
How the Imubit Platform applies
In cement, the Imubit Platform applies Map, Model and Control to the kiln line. Map traces fuel, power and CO₂ per tonne to the recurring decisions behind them, such as the burn target against free lime, excess air and draft, and the alternative fuel rate as fuel quality changes. Model learns the causality of the kiln and mills from the plant's own history with Deep Learning Process Control® (DLPC®). Control takes those decisions to closed loop on top of the existing APC and DCS, with operators able to take over at any time. On one cement producer's kiln pyroprocess running in closed loop, the result was a 20 to 30% reduction in process variability.