Most process plants have decades of instrumentation behind them: sensors, historians, laboratory systems and advanced process control (APC). What many still lack is a way to turn that data into decisions fast enough to matter while feed quality, prices and emissions limits move under them. With tight margins and tighter sustainability requirements, a small percentage gain in yield or energy is worth a great deal.
AI models can now learn a unit's nonlinear behavior from that data, find operating room that fixed strategies miss, and in closed loop write setpoints back to the distributed control system (DCS), inside limits set by plant engineers. That is the step from historical dashboards toward self-optimizing plants.
From data collection to real-time decisions
Industrial intelligence started with storing sensor tags in a historian. Conventional APC added control of a single unit against a model identified from plant tests. Learning models extend that reach. They track key performance indicators as they drift, help shorten troubleshooting, and can close the loop by writing fresh setpoints to the DCS.
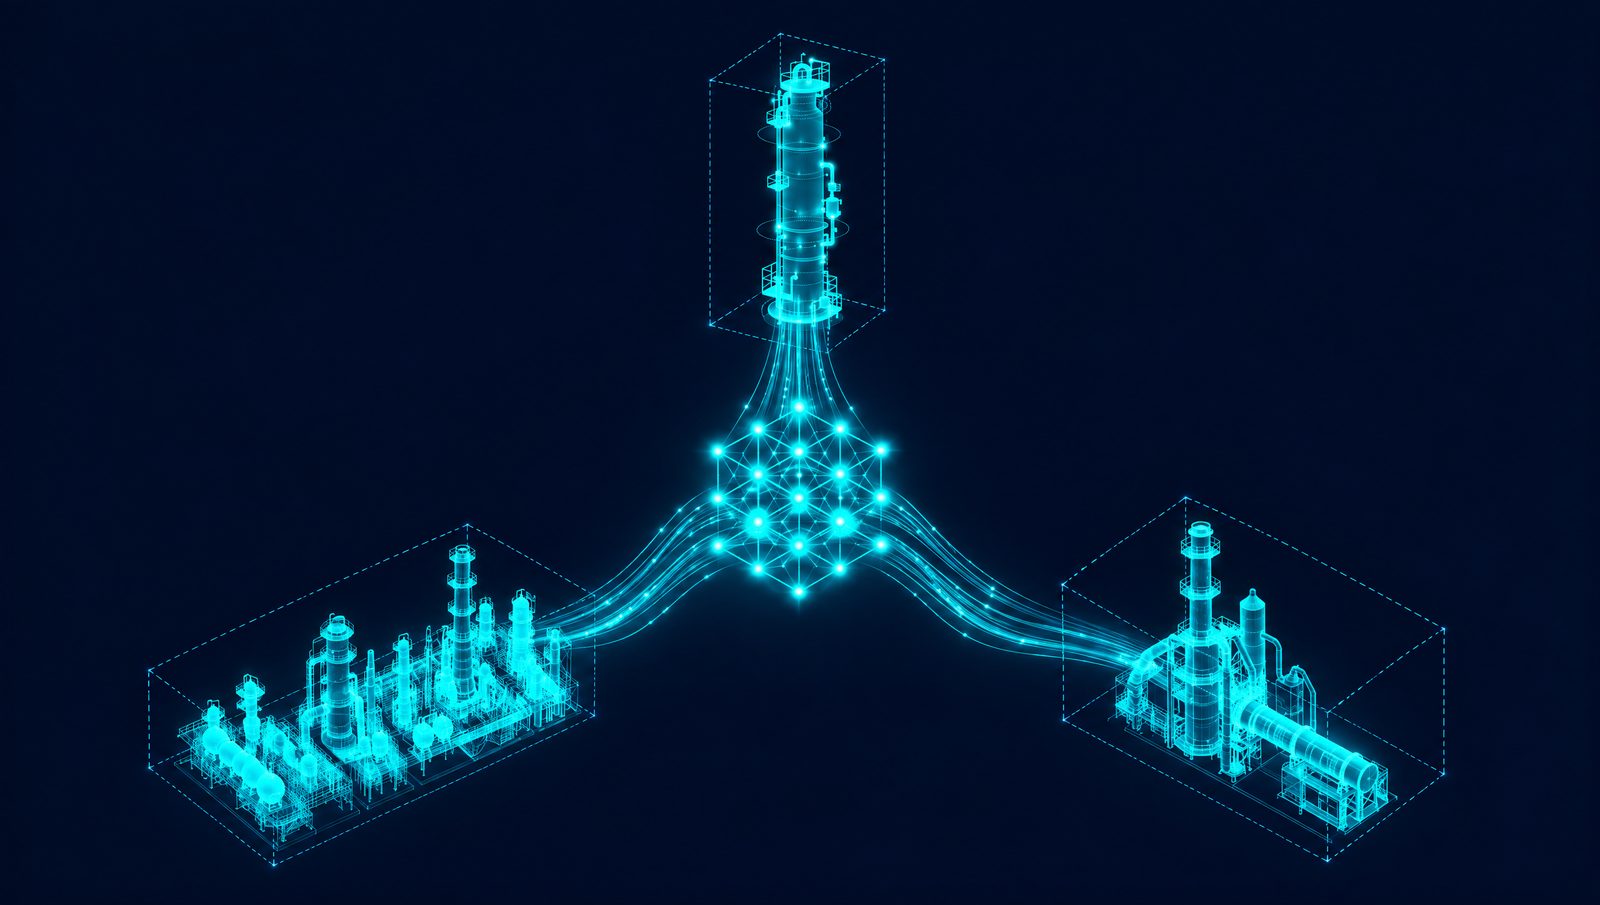
A single-variable loop holds one temperature or pressure. A plant-wide view links thousands of tags across production, maintenance, energy and safety, and traces how a change in one place shows up somewhere else. A feed change at the front of the plant moves through every downstream unit. Seeing that chain is the basis for optimizing across units instead of loop by loop.
From siloed tags to cross-unit insight
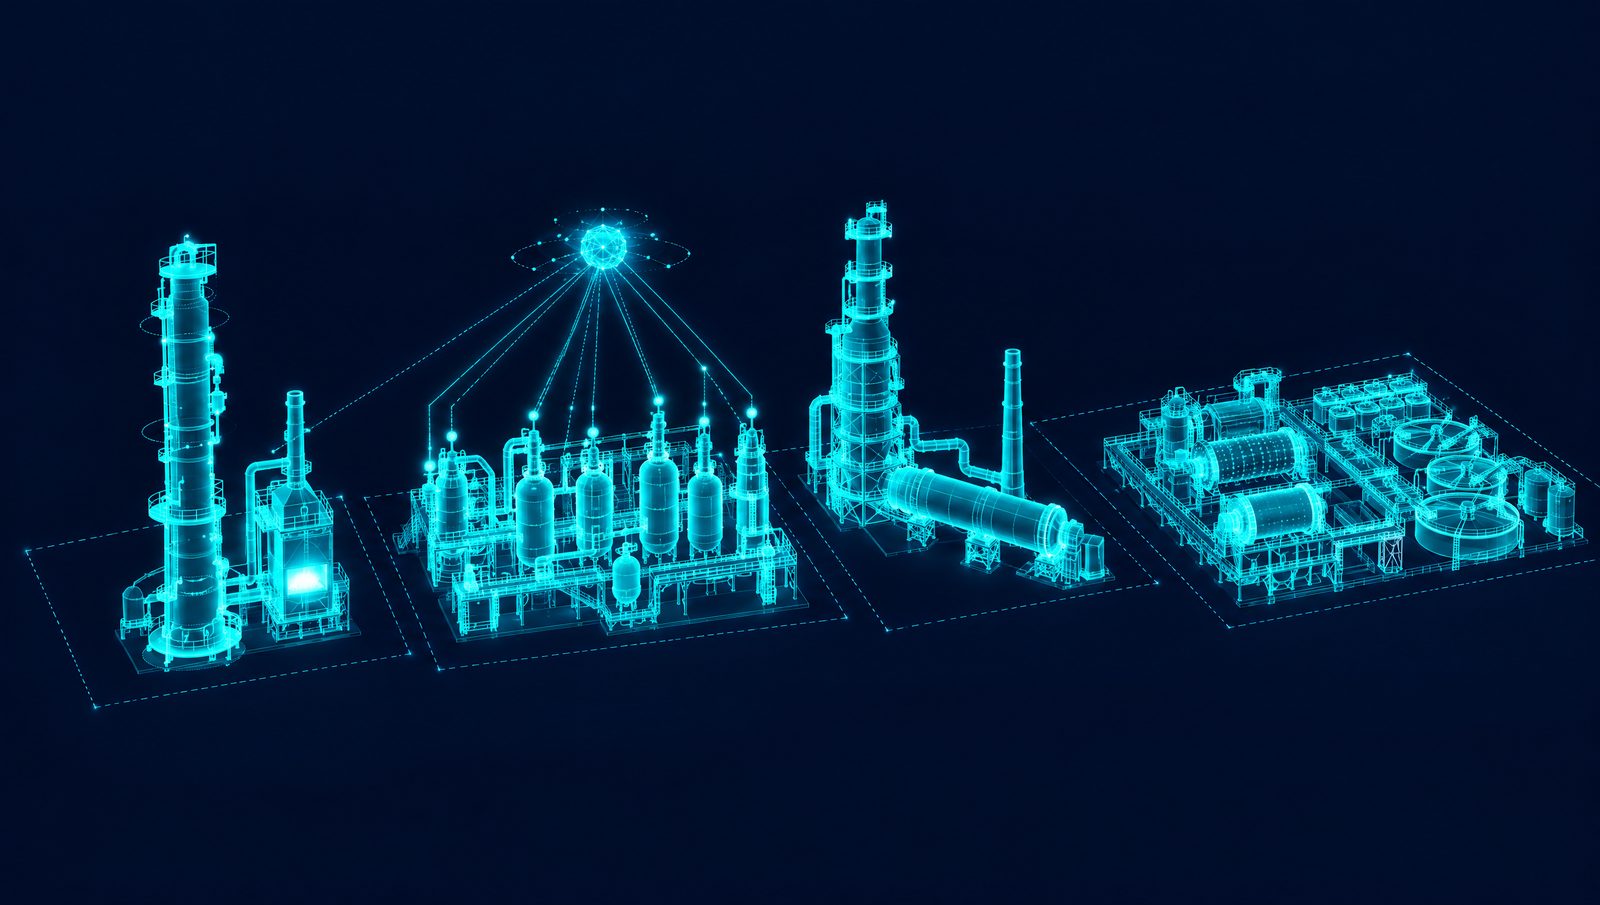
A unit's tags tell part of the story. Layered with context, such as equipment metadata, lab results and economic limits, they show relationships that isolated dashboards miss. Aligned on a shared timeline, thousands of time-stamped signals can show how a modest pressure swing upstream changes steam demand three units away.
Once the tags sit in one model, patterns appear that single-loop control does not see. A feed-quality change can erode downstream yield hours later. An unexplained energy spike can trace back to valve behavior in an auxiliary system. A model that has learned how those events connect can identify the moves that protect yield and avoid rework, and a closed-loop controller can make those moves in real time.
For operators, the result is a view of the whole process: how an upstream decision moves through the system, and how events that look unrelated combine to affect performance.
Building and securing the data backbone
The plant already produces the data it needs. Smart sensors, control systems, historians, edge gateways and industrial IoT devices record plant behavior every second. The task is to make those systems share data in real time without disturbing what already works.
Industry-standard data gateways stream data from the control systems into a secure integration layer. A replicated historian protects the core control network while exposing high-resolution tags for analysis. Role-based access keeps maintenance, engineering and energy teams within their own areas while all of them work from the same data source.
On that backbone, industrial AI runs as an overlay on the existing control system. It can be added while the plant runs, with no changes to control logic or to the safety systems.
Why data context matters more than data volume
Terabytes of sensor readings will not move plant metrics if the data lacks meaning. Structuring the essentials, which are time-aligned tags, cost markers and lab results, lets a model see what each number represents.
Without that context, common faults lead models to chase noise. Time stamps drift, lab samples are poorly aligned with process data, and data stays locked in isolated systems.
Four steps build the foundation:
- Synchronize clocks across the control system, historian and lab instruments so events line up in time.
- Add economic relevance to critical tags. A cost field turns a pressure change into a margin signal.
- Label golden batches for quality metrics, so the model has a clear target in each production run.
- Apply data governance that weights reliable sources and sets aside corrupted streams.
Keep high-resolution data in place of aggregated averages. Granular traces let a model detect the small patterns that come before a yield swing or an energy surge. Context turns raw data into information a controller can act on, while volume alone mostly adds to storage costs.
Choosing an optimization approach
The choice comes down to how much decision-making sits in the control layer. Each approach works within its own boundaries:
- Rule-based scripts catch obvious alarms.
- Conventional APC smooths and coordinates the loops of one unit.
- Linear-program models align unit economics, usually in planning and scheduling.
- Machine-learning models capture nonlinear interactions across hundreds of tags, but usually stay advisory until an engineer approves each move.
- First-principles models do well where the physics dominates, though they struggle with noisy or drifting sensors.
- Hybrid models combine data and first principles, improving accuracy while keeping the model interpretable.
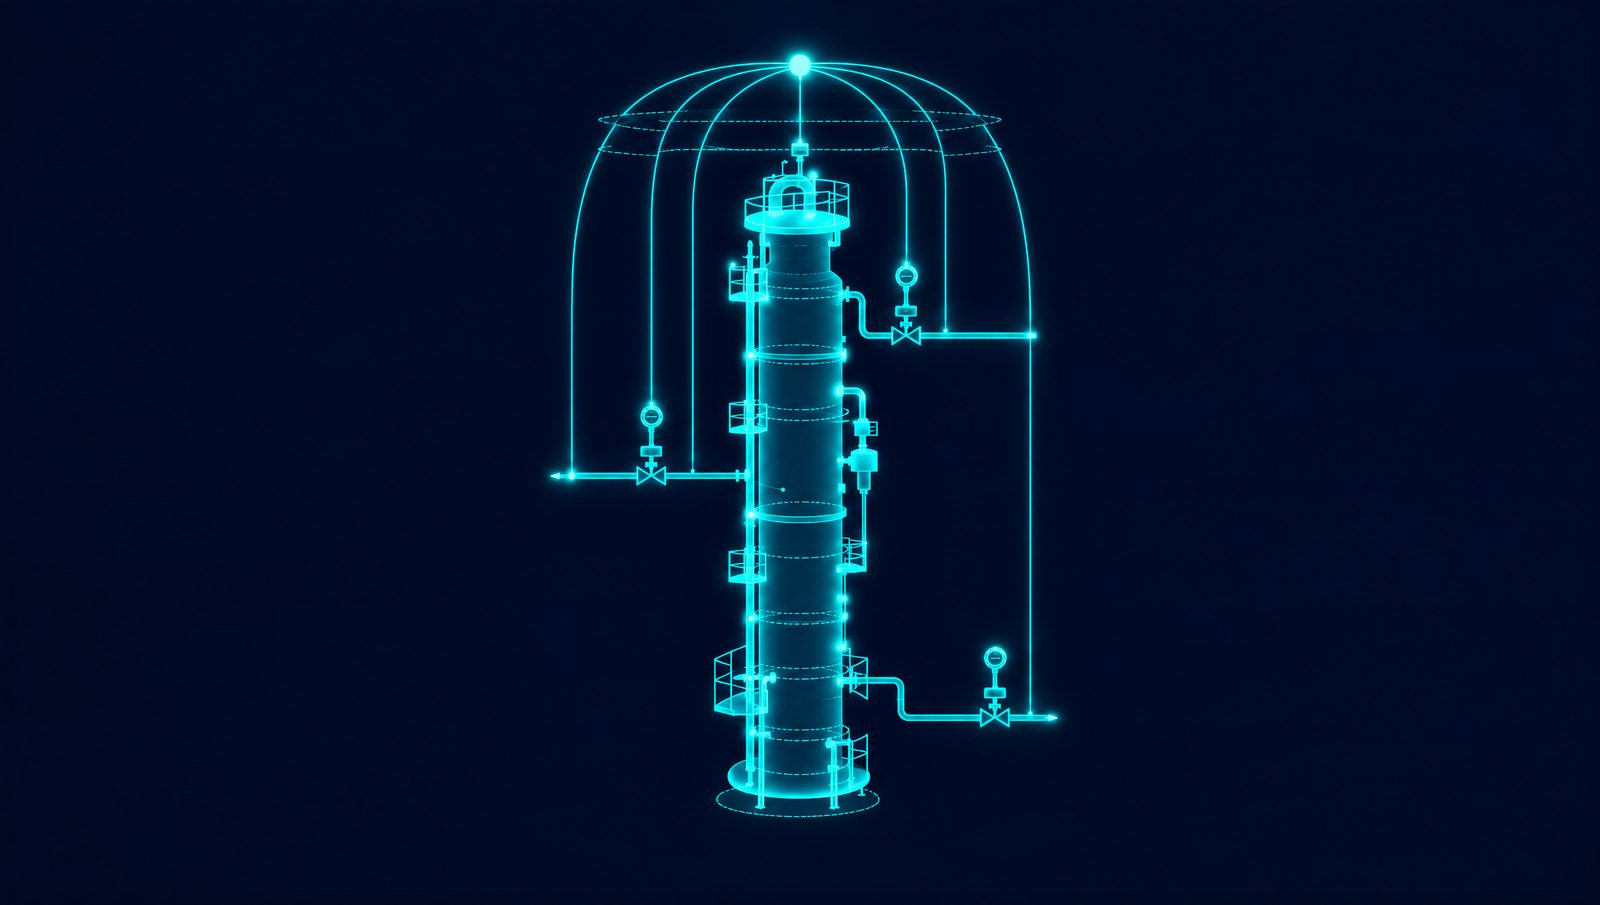
Capturing plant-wide margin takes controllers that both learn and act. A closed-loop controller learns the unit's behavior from its history and, within stability safeguards and the limits operators set, writes setpoints to the control system in real time. It works on top of the existing APC and DCS.
Closing the gap between insight and action
Moving from analytics to measurable improvement starts with a tightly scoped application. Pick a high-impact constraint, such as a yield-limiting column or an energy-hungry furnace, and give the controller a clear economic target. Run it in advisory mode at the start, and compare its recommendations against historian data and operator decisions before granting closed-loop control.
Once the data confirms value, decide whether the application stays in open loop or writes setpoints directly to the control system. In open loop, each recommendation waits for someone to act on it, which adds minutes of latency. In closed loop, the controller responds as conditions change and captures short-lived opportunities that manual moves miss. Operators can override it.
Track the results against the economic target: margin, energy intensity and the time it takes to diagnose a KPI deviation. Clear evidence from one unit builds internal support, lowers the risk of a broader program and sets up optimization across the site.
Explainable AI that operators trust
Operators need to understand a recommendation before they will trust it on a high-stakes unit. Explanations work best inside the control room's own tools: displays that show the variables behind each recommendation, and alerts in the screens operators already use.
Plain-language summaries of trends help each shift understand the reasoning behind a move. A log of every setpoint change and its rationale creates a searchable audit trail for compliance and post-event reviews.
Operators should be able to flag a questionable move, and those flags should feed model reviews and retraining. Shared notes capture this operating knowledge and turn individual observations into common practice across the plant.
Where the gains show up
- Energy and yield: lower energy intensity alongside higher throughput and better product quality.
- Safety and reliability: earlier detection of abnormal conditions, and tighter control that stabilizes quality and emissions.
- Operating efficiency: faster root-cause diagnosis that shortens downtime, with each improvement becoming the new baseline.
Value over the long term
Much of the value comes after start-up. A controller that tracks real-time economics alongside process limits keeps steering the plant toward its most profitable operating window as feed costs rise or demand falls. The same data foundation gives operations, maintenance and energy teams a shared language, and decisions are tested against the same performance indicators.
Because the models learn from process and lab data, they hold a record of how the plant behaves that new engineers and operators can learn from. When regulations add constraints on carbon, water or safety, those constraints can be added to the controller and optimization continues within them.
How the Imubit Platform applies
Imubit applies this approach in refining, chemicals and polymers, cement, and mining and minerals, following Map, Model and Control. Map traces plan-to-plant gaps to the recurring decisions behind them. Model uses Deep Learning Process Control® (DLPC®) to learn a nonlinear dynamic model of each unit from its own history, guided by first principles. Control takes the critical decisions to closed loop, writing setpoints to the existing APC or DCS minute by minute, inside limits set by plant engineers. See the platform.