Energy sits alongside feedstock and labor as one of the largest costs in most chemical plants, and its price volatility can erase thin margins quickly. Utilities combustion and purchased power also drive a large share of Scope 1 and 2 emissions, which puts energy use on corporate ESG scorecards and exposes the plant to emerging carbon costs.
Reducing that cost starts with knowing where every kilojoule goes. Three connected strategies help: real-time visibility, linking process conditions to energy use, and AI-driven setpoint control. Together they reveal hidden waste, tie it to specific operating conditions, and then automate the most energy-intensive decisions.
The room for improvement is measurable. A 2017 study by Boyd and Lee, funded by the U.S. Energy Information Administration and based on plant-level census data, estimated that if every plant in the energy-intensive chemical sectors performed at the 90th percentile of its sector's efficiency distribution, energy use would fall by 4 to 13%. Operational levers can capture part of that gap without major capital projects, trimming utility costs, cutting emissions and protecting throughput and product quality.
The outlook for chemical plants
Chemical manufacturing is among the most energy-intensive sectors of industry, with high steam, electricity and fuel demand across reactors, distillation trains and compressor networks. Price volatility has widened cost differences between units and even between batches, which has raised energy from a routine expense to a board-level concern.
Corporate ESG targets and tightening decarbonization mandates push plants to cut emissions without giving up throughput. Some of that has to come from running existing equipment better.
With capital budgets constrained, the focus has shifted from large retrofits to digital and operational levers: real-time monitoring, utilities optimization and AI-assisted control.
1. Make energy use visible in real time
Weekly spreadsheets hide costly losses. By the time a utility report arrives, steam traps may have leaked for days and compressors may have drifted into inefficient load bands. Energy dashboards that stream data from the distributed control system (DCS), historians and utility meters show deviations as they occur.
Real-time visibility moves decision-making from reactive to proactive. When every kilowatt, kilogram of steam and cubic meter of fuel gas updates in seconds, teams can correct valve misalignments before they vent to atmosphere and schedule cleaning before fouling erodes heat transfer. Predictive models can also forecast the next day's constraints, so setpoints can be adjusted ahead of price spikes or ambient swings.
A monitoring setup pulls from utility meters, critical process tags and IoT sensors, validates the signals and publishes clear charts in the control room and in daily reviews. Alerts fire when KPIs breach statistical limits, which creates accountability and speeds root-cause analysis. Start with these steps:
- Map unmetered utilities, especially steam, fuel gas and compressed air, and install flow or pressure transmitters.
- Set update intervals of one minute or less for all high-impact KPIs.
- Publish dashboards to the control room and use them in the daily production meeting.
- Configure alerts for deviations beyond normal operating variance, in addition to hard alarms.
Faster detection of anomalies shortens the time a loss runs before someone acts on it, which shows up directly in the utility bill.
2. Link process conditions to energy performance
Energy is wasted every second that reactors, columns and compressors drift from their most efficient operating points. A small shift in column pressure or compressor suction temperature ripples through the utilities and raises fuel or electricity demand.
Start with the variables that matter most:
- Reflux ratio and column pressure in distillation, which set reboiler steam consumption
- Reactor temperature and residence time, which set heating and cooling duty
- Compressor discharge pressure, which drives electricity demand
- Pump and fan speed, which set motor load and power draw
Each is usually tuned as a process variable for its own unit, so its combined effect on site energy is easy to miss.
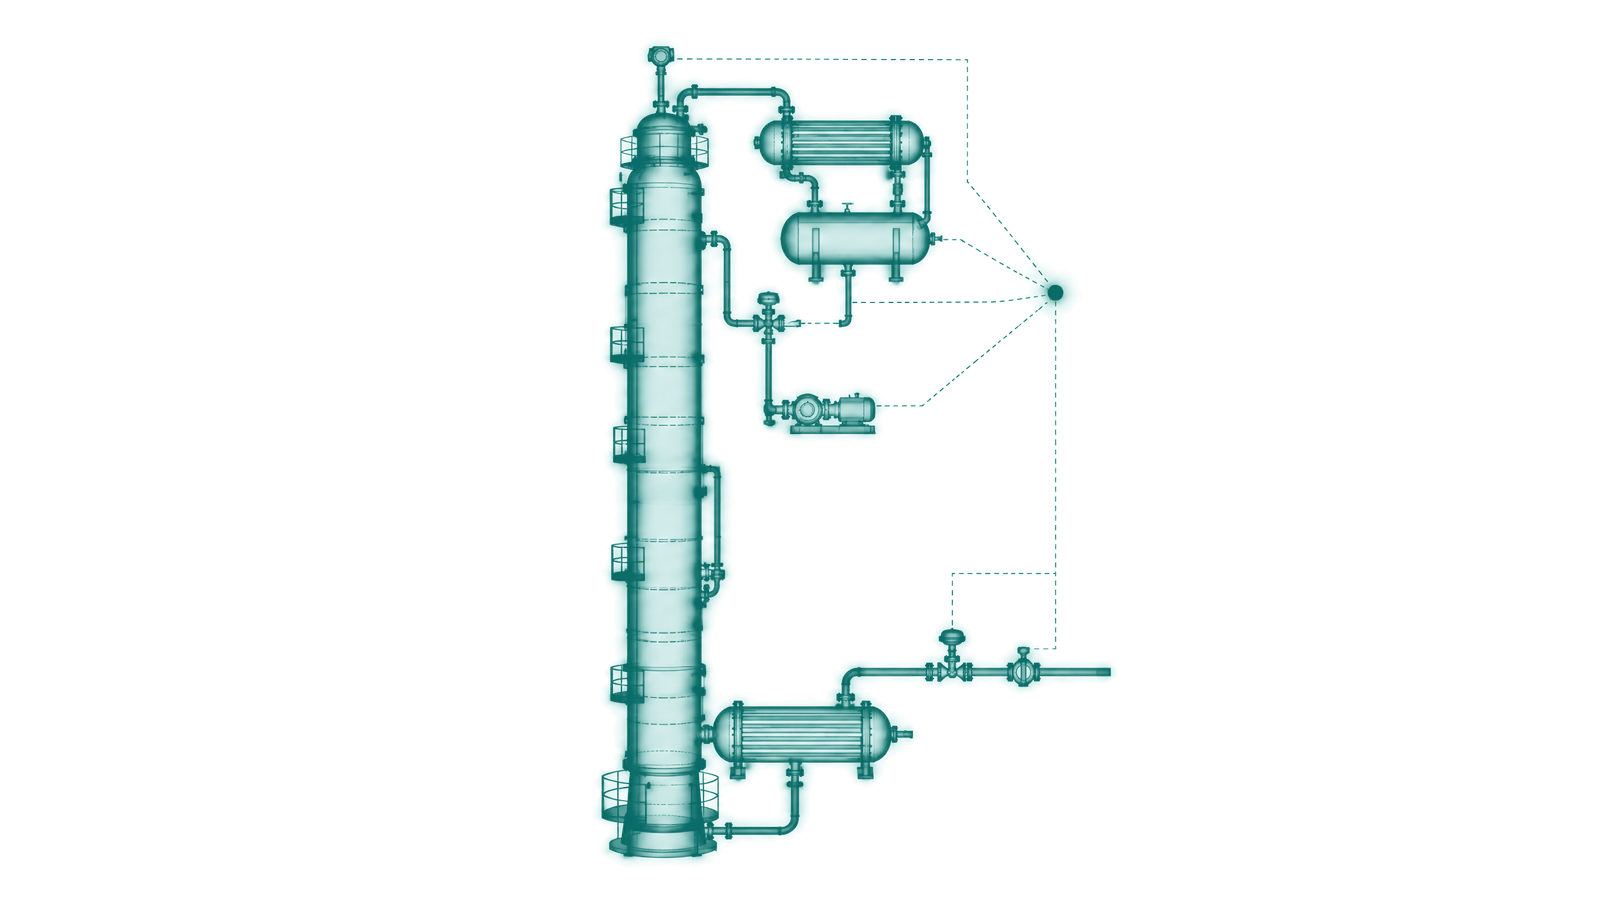
Historical analysis with multivariate regression or principal component analysis (PCA) shows which setpoints affect utility KPIs most. First-principles methods such as pinch analysis expose thermodynamic bottlenecks, and simulation models let you test scenarios before anything changes in the DCS. Correlation shows where to look. Knowing what a setpoint change will do takes a model of how the unit responds.
A practical sequence:
- Pull historian data from existing systems.
- Relate energy intensity to the key process variables.
- Review the findings with process engineers to build agreement.
- Set new targets based on the analysis.
- Keep monitoring so the gains do not drift back to earlier levels.
3. Automate energy-intensive setpoints with AI
Manual setpoint tuning is expensive. Operators rely on experience or trial and error, so compressors work harder than needed, columns over-reflux and furnaces burn excess fuel.
AI models trained on years of historian data can write setpoints to the DCS continuously, within limits set by operations, weighing many combinations of moves to balance product quality, throughput and energy intensity. Physics-informed models give fast, plant-specific predictions of how temperature, pressure and flow changes ripple through the system. A reinforcement learning (RL) controller searches that model for lower-consumption operating points while respecting safety and quality constraints. Plain explanations of each move help build operator trust before the loop is closed.
Start with a well-instrumented loop where costs are measurable, such as a steam-driven compressor or a fired heater. Build and validate the model on historical data, run it in advisory mode against economic scenarios and involve control-room teams early, so every change is understood before closing the loop.
How Imubit applies this
In chemicals and polymers, Imubit applies Map, Model and Control to energy, yield and throughput. Map traces plan-to-plant gaps in utilities and energy intensity to the recurring decisions behind them. Model uses Deep Learning Process Control® (DLPC®), in which a Deep Learning Predictor learns a nonlinear dynamic model of each unit from its own history, guided by first principles. Control takes the critical decisions to closed loop: a Deep Learning Controller trained by reinforcement learning writes setpoints to the existing APC or DCS minute by minute, inside limits set by plant engineers. Where energy is the optimization target, this has delivered a 15 to 30% reduction in energy consumption.