This post is from our 2020 to 2021 Economic Engineering series of refining market commentary. It reflects market conditions in September 2021.
Natural gas prices reach multi-year highs
The biggest change in the market in late summer 2021 was natural gas. Global demand was outstripping supply, and the era of cheap energy looked to be pausing, if not ending. U.S. supply had barely kept pace with LNG feed gas demand, which left the U.S. net balanced to slightly short. Near-month NYMEX natural gas futures reached prices not seen in North America for years.
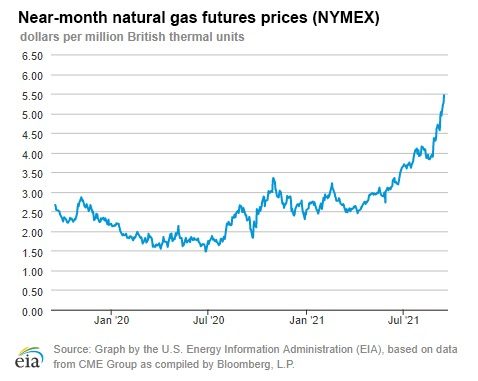
Figure 1: NYMEX natural gas futures, near month. Source: U.S. Energy Information Administration, Natural Gas Weekly Update.
The trend was global. Low inventories in Europe had the Dutch TTF marker trading near $20/MMBtu, with the Platts Japan/Korea Marker (JKM) at similar levels. At those prices energy becomes a real factor in plant optimization. Burning the extra Btu to get the last bit of fractionation may no longer pay, depending on prices and equipment.
Carbon costs add to energy costs in the EU
On top of record or near-record gas prices, EU hydrocarbon processors were also paying more to emit carbon. Barchart data for the September 2021 ICE EUA futures contract show the EU cost of carbon up 50% since March, from EUR 42 to EUR 63 per tonne of CO2 (US$49 to 74).
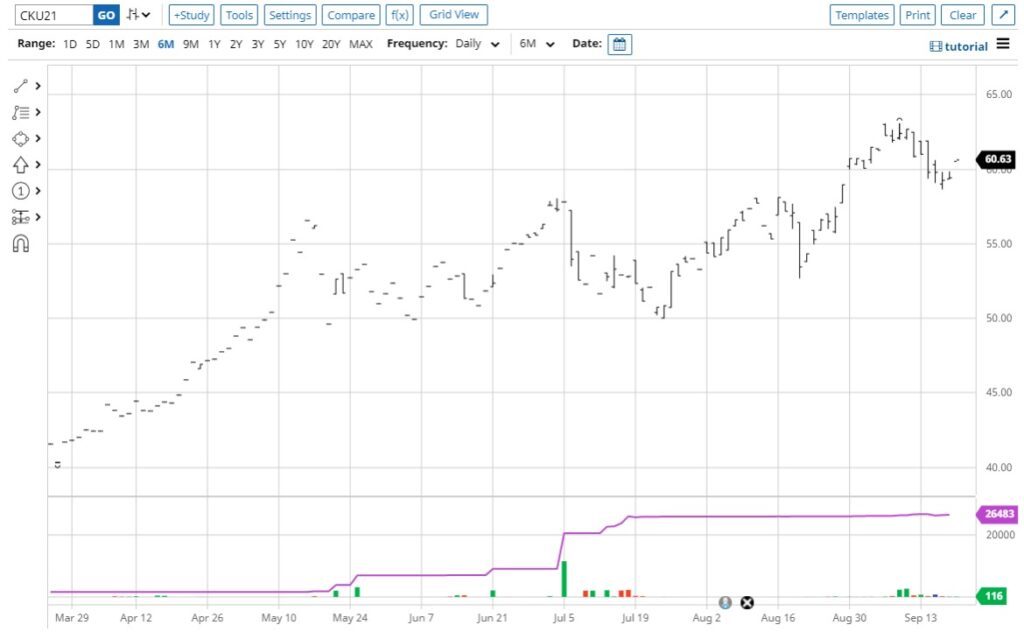
Figure 2: ICE EUA futures, September 2021 contract. Source: Barchart, CKU21.
Higher carbon costs make it harder to switch to a cheaper fuel that is more carbon intensive, because the carbon penalty on fuels with a higher carbon-to-hydrogen ratio raises their total cost. The table below estimates that penalty by fuel at a carbon price of EUR 63 per tonne, about US$75.
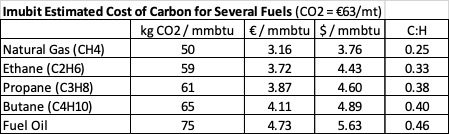
Figure 3: Imubit's estimate of EU carbon cost by fuel gas component, September 2021.
The total cost of energy
In the U.S., energy optimization in process units starts to matter more at around $5/MMBtu. The larger issue is the total cost of energy in regions that import LNG at the margin, such as Asia, Europe and the UK. With the EU carbon cost added to the gas price, our estimate at the time put the total cost of energy in the EU at about $24/MMBtu. For European operators, managing energy use and weighing it against yield and throughput becomes a central part of running the plant.
Optimizing energy against yield and throughput
The trade-off between energy intensity, yield and throughput is nonlinear, and the best operating point moves with gas, carbon and product prices. Closed-loop optimization with Imubit's Deep Learning Process Control® (DLPC®) can weigh that trade-off continuously against current market prices, writing to the existing APC or DCS, inside limits set by plant engineers. The case is stronger at sites that can burn hydrogen or blend other fuel components with a different carbon intensity into the fuel system, because the fuel mix then becomes one more variable in the trade-off.