

Archive: market commentary from June 2021, written by Imubit's Economic Engineering team. Prices, inventories and forecasts reflect conditions at the time.
Refining crack spreads have drawn attention recently for sitting at favorable levels. That is true on the surface, but the actual profitability of domestic fuels production also depends on the current value of the Renewable Volume Obligation (RVO). The RVO can be large, and it has recently reached new highs. We start with the crack spread as it is usually quoted for gasoline and diesel:
Crack spread = fuel product value minus crude value
It is easy to calculate from market prices, such as the wholesale price of unleaded regular gasoline (ULR) or No. 2 heating oil (HO) against the West Texas Intermediate (WTI) crude price. Refining profitability is not measured by the crack spread alone. On top of crude cost, the refinery pays variable operating costs for energy, catalysts and chemicals. The marker price is often not what the refinery receives for incremental production, because transportation and market demand limit where the extra barrels can go, and the incremental market may be far away. The last piece, which subtracts directly from profitability, is the RVO.
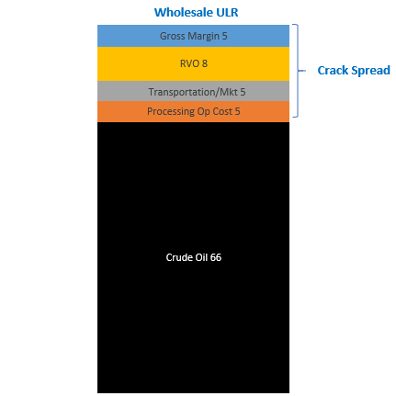
Figure 1: The RVO, transportation and variable operating costs subtract from the crack spread and leave something closer to actual refinery gross margin. Imubit illustration.
Even this picture is a simplification. A refinery produces many products at once, and cracking processes create volume gain, so crude does not map to gasoline and diesel one for one once all the effects are counted. That is why refiners use LP models to set crude and product slates and unit conditions.
Why RVO and RIN prices are up
Commodity and consumer goods prices are rising, driven by strong demand, Covid-19 inventory draws, capacity idled during the pandemic and regional droughts. Corn and soybeans are no exception. Corn is the main feedstock behind the D6 (ethanol) Renewable Identification Number (RIN), and soybean oil is the main feedstock behind the D4 (biomass-based diesel) RIN.
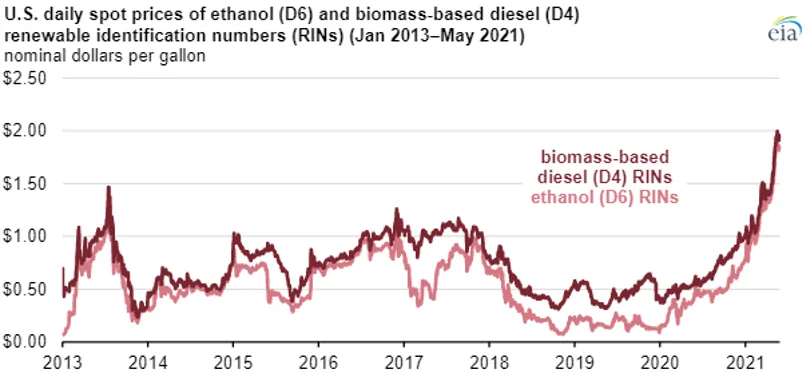
Figure 2: D4 and D6 RIN prices reached historical highs in May 2021 as corn and soybean prices rose. Source: EIA.
The RVO is calculated from a proportion of RIN prices, including the two rarer and more expensive RINs: D3 for cellulosic biofuel and D5 for advanced biofuel. The EPA's annual compliance data page outlines the calculation in general terms. The Renewable Fuel Standard (RFS) program sets out a complex framework, and the relationship is hard to state exactly. For most purposes it is enough to know that the RVO tracks RIN prices in a roughly linear way. For our own internal price sets, we approximate the RVO cost with a function that is linear in the D4 and D6 RIN prices.
A better view of the crack spread: RVO adjusted
These complexities may be why many sources, the EIA included, do not show RVO-adjusted crack spreads. They matter, though, for judging whether an observed crack spread will turn into refinery profit. Everyone on our team has worked in planning and economics at major refining and petrochemical companies, and in our experience many refiners track the RVO-adjusted crack internally alongside the market crack. The adjustment is:
RVO-adjusted crack spread = fuel product value minus RVO minus crude value
Trended over recent months for gasoline, the RVO-adjusted crack spread (green in Figure 3) follows a different path from the market crack spread (blue).
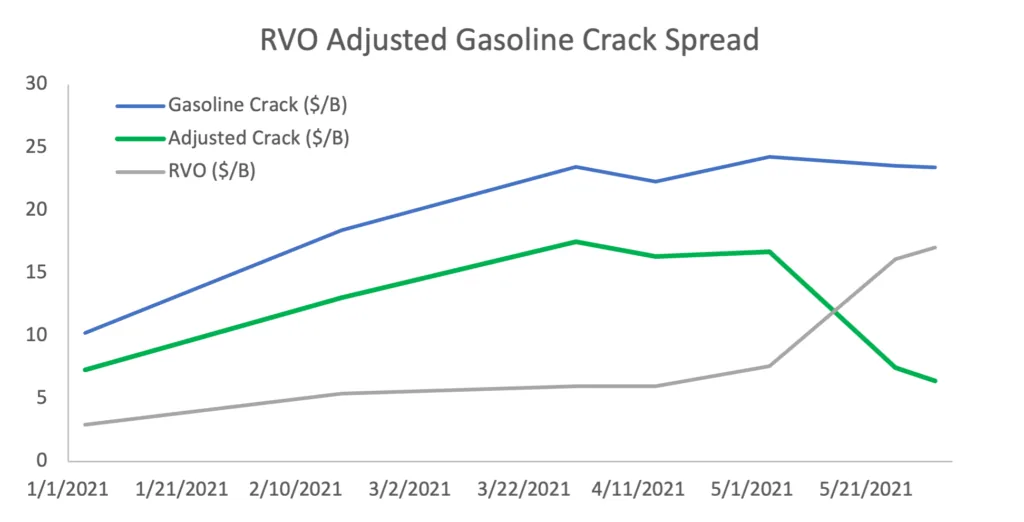
Figure 3: Imubit estimate of the RVO-adjusted gasoline crack spread, from several public sources and Imubit assumptions. Public EPA RIN price data lags the market, so the last two points are drawn from Figure 2.
With the recent run-up in RIN prices, the RVO has eaten into actual US refining profitability. The gasoline crack is high, but not high enough to offset the higher RIN cost. With diesel and gasoline stocks still drawing, the market gasoline crack may need to rise further to cover the cost of complying with the federal RFS program.
Optimizing against the adjusted margin
When the adjusted crack is thinner, a generic instruction such as "max gasoline" may not be granular enough to capture the margin that is available. Optimizing each unit every few minutes against a live objective function that reflects current prices and the site's most important strategies lets the plant keep balancing its many trade-offs as conditions change. Deep Learning Process Control® (DLPC®) does this in closed loop, writing targets to the existing APC or DCS, inside limits set by plant engineers.