Archive: market commentary from July 2021, written by Imubit's Economic Engineering team. Prices, inventories and forecasts reflect conditions at the time.
This update steps back to look at global supply and demand for oil, transportation fuels and petrochemical feedstocks. Covid-19 caused a large reset in oil product demand that is still moving through the markets. Some of the changes are likely to last, reinforced by trends toward reducing the effects of climate change. They come from individuals (telecommuting, for example), the private sector (the push on ESG), activists pressing governments and other bodies, and government action.
Most of what follows draws on projections from the International Energy Agency (IEA) in its Oil 2021 report, which is worth reading in full for its view of the macroeconomic environment and its effects on supply and demand. We pulled out a few points that matter for refining and petrochemicals, starting with total oil demand across all end uses.
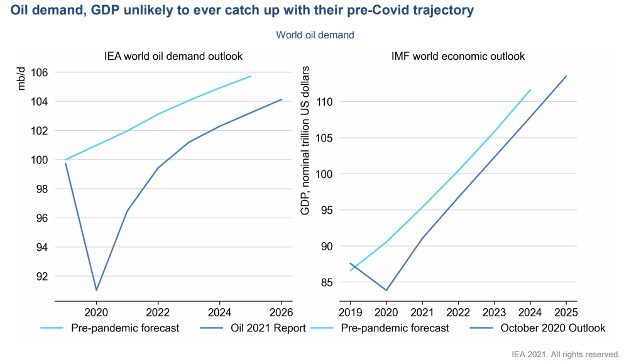
Figure 1: IEA projection of world oil demand alongside the IMF outlook for world gross domestic product (GDP). Neither is expected to return to its pre-pandemic trajectory. Source: IEA (2021), Oil 2021, IEA, Paris.
The chart shows the lasting economic scarring from the pandemic. Global GDP is now expected to follow a different curve, though it still rises at a healthy rate. The oil demand forecast includes the shift to electric vehicles (EVs), the sudden increase in working from home and a likely lasting change in how business is conducted in the developed world. The pandemic accelerated some of these trends.
Gasoline demand peaked in 2019
By the IEA's projection, the growth in global oil demand will not go into gasoline. Chemicals are the main driver of demand growth in its medium-term outlook.
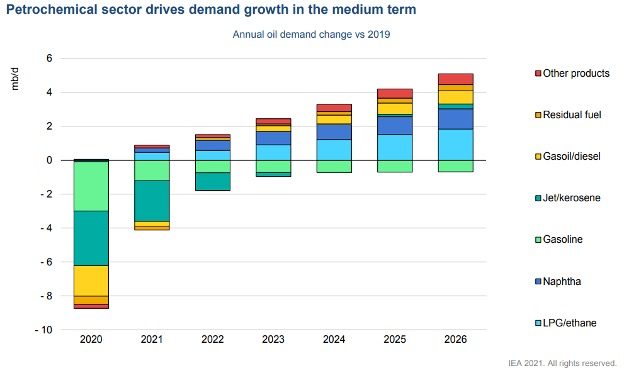
Figure 2: World gasoline demand stays below 2019 levels through 2026, and new oil demand comes from petrochemical end uses and diesel. Source: IEA (2021), Oil 2021.
The IEA does not project a peak in oil demand yet. Figures 2 and 3 do show that gasoline demand peaked in 2019. Gasoline demand in the OECD countries is already declining, and EV adoption, behavioral change and efficiency gains will accelerate that decline. Even with strong EV adoption in China, which the IEA expects to triple by 2026, gasoline demand there still rises slightly.
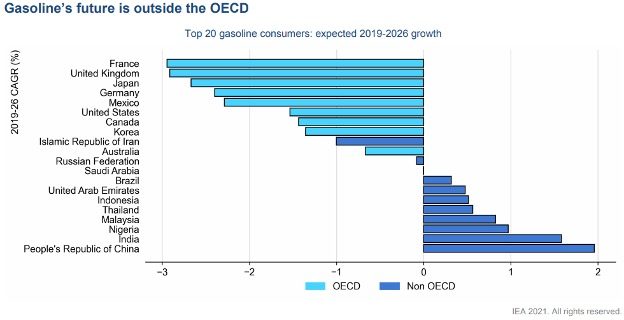
Figure 3: Much of the OECD (Organisation for Economic Co-operation and Development) has already passed peak gasoline demand, and growth comes mainly from non-OECD countries. Source: IEA (2021), Oil 2021.
This transition, together with global oil production and refining footprints, will keep shifting trade flows and encourage more gasoline exports from North American and European refiners. If capacity keeps expanding in Asia, the Middle East and Africa, more capacity rationalization in North America and Europe is likely.
Jet returns to normal by 2024
Jet fuel offers little growth. The IEA sees jet demand returning to normal by 2024 and growing slowly after that, which means a couple more years of relatively low jet margins against diesel.
Diesel shifts geographies, as gasoline does
Unlike gasoline, the IEA does not see diesel demand peaking yet. As Figure 4 shows, demand rises in some regions and offsets efficiency gains in others. Diesel is much harder to replace with battery electric power because of the high energy density its uses require. Blue and green hydrogen are discussed as an alternative, but they have yet to be shown practical and scalable.
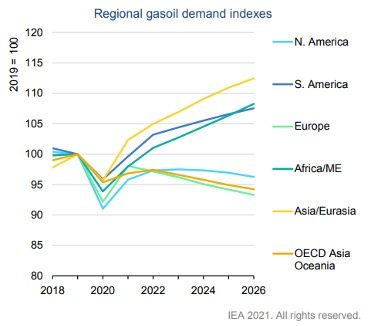
Figure 4: Regional gasoil demand indexes show diesel growth moving to Asia, Africa, the Middle East and South America, while Europe, North America and OECD Asia decline. Source: IEA (2021), Oil 2021.
What it means for refiners
Hydrocarbon processors, refiners above all, face a period of flux over the medium term while the path to decarbonization becomes clearer. Supply and demand will move geographically, and refiners will need to respond quickly when arbitrages open. That can mean switching from diesel to gasoline at short notice, and at times against the season. Refiners that prepare to change operating modes quickly and hold each unit near its constraints against current prices will be better placed. Deep Learning Process Control® (DLPC®) supports that in closed loop, adjusting unit targets against a live economic objective on top of the existing APC and DCS, inside limits set by plant engineers.